🏥Health
Nhs Productivity
Upfront
+£3.0bn
Annual
-£12.0bn
Revenue
+£4.0bn
Net Annual Effect
-£8.0bn/year
Payback in 2 years
GDP +0.8%Productivity +0.2%high uncertainty
3 sources
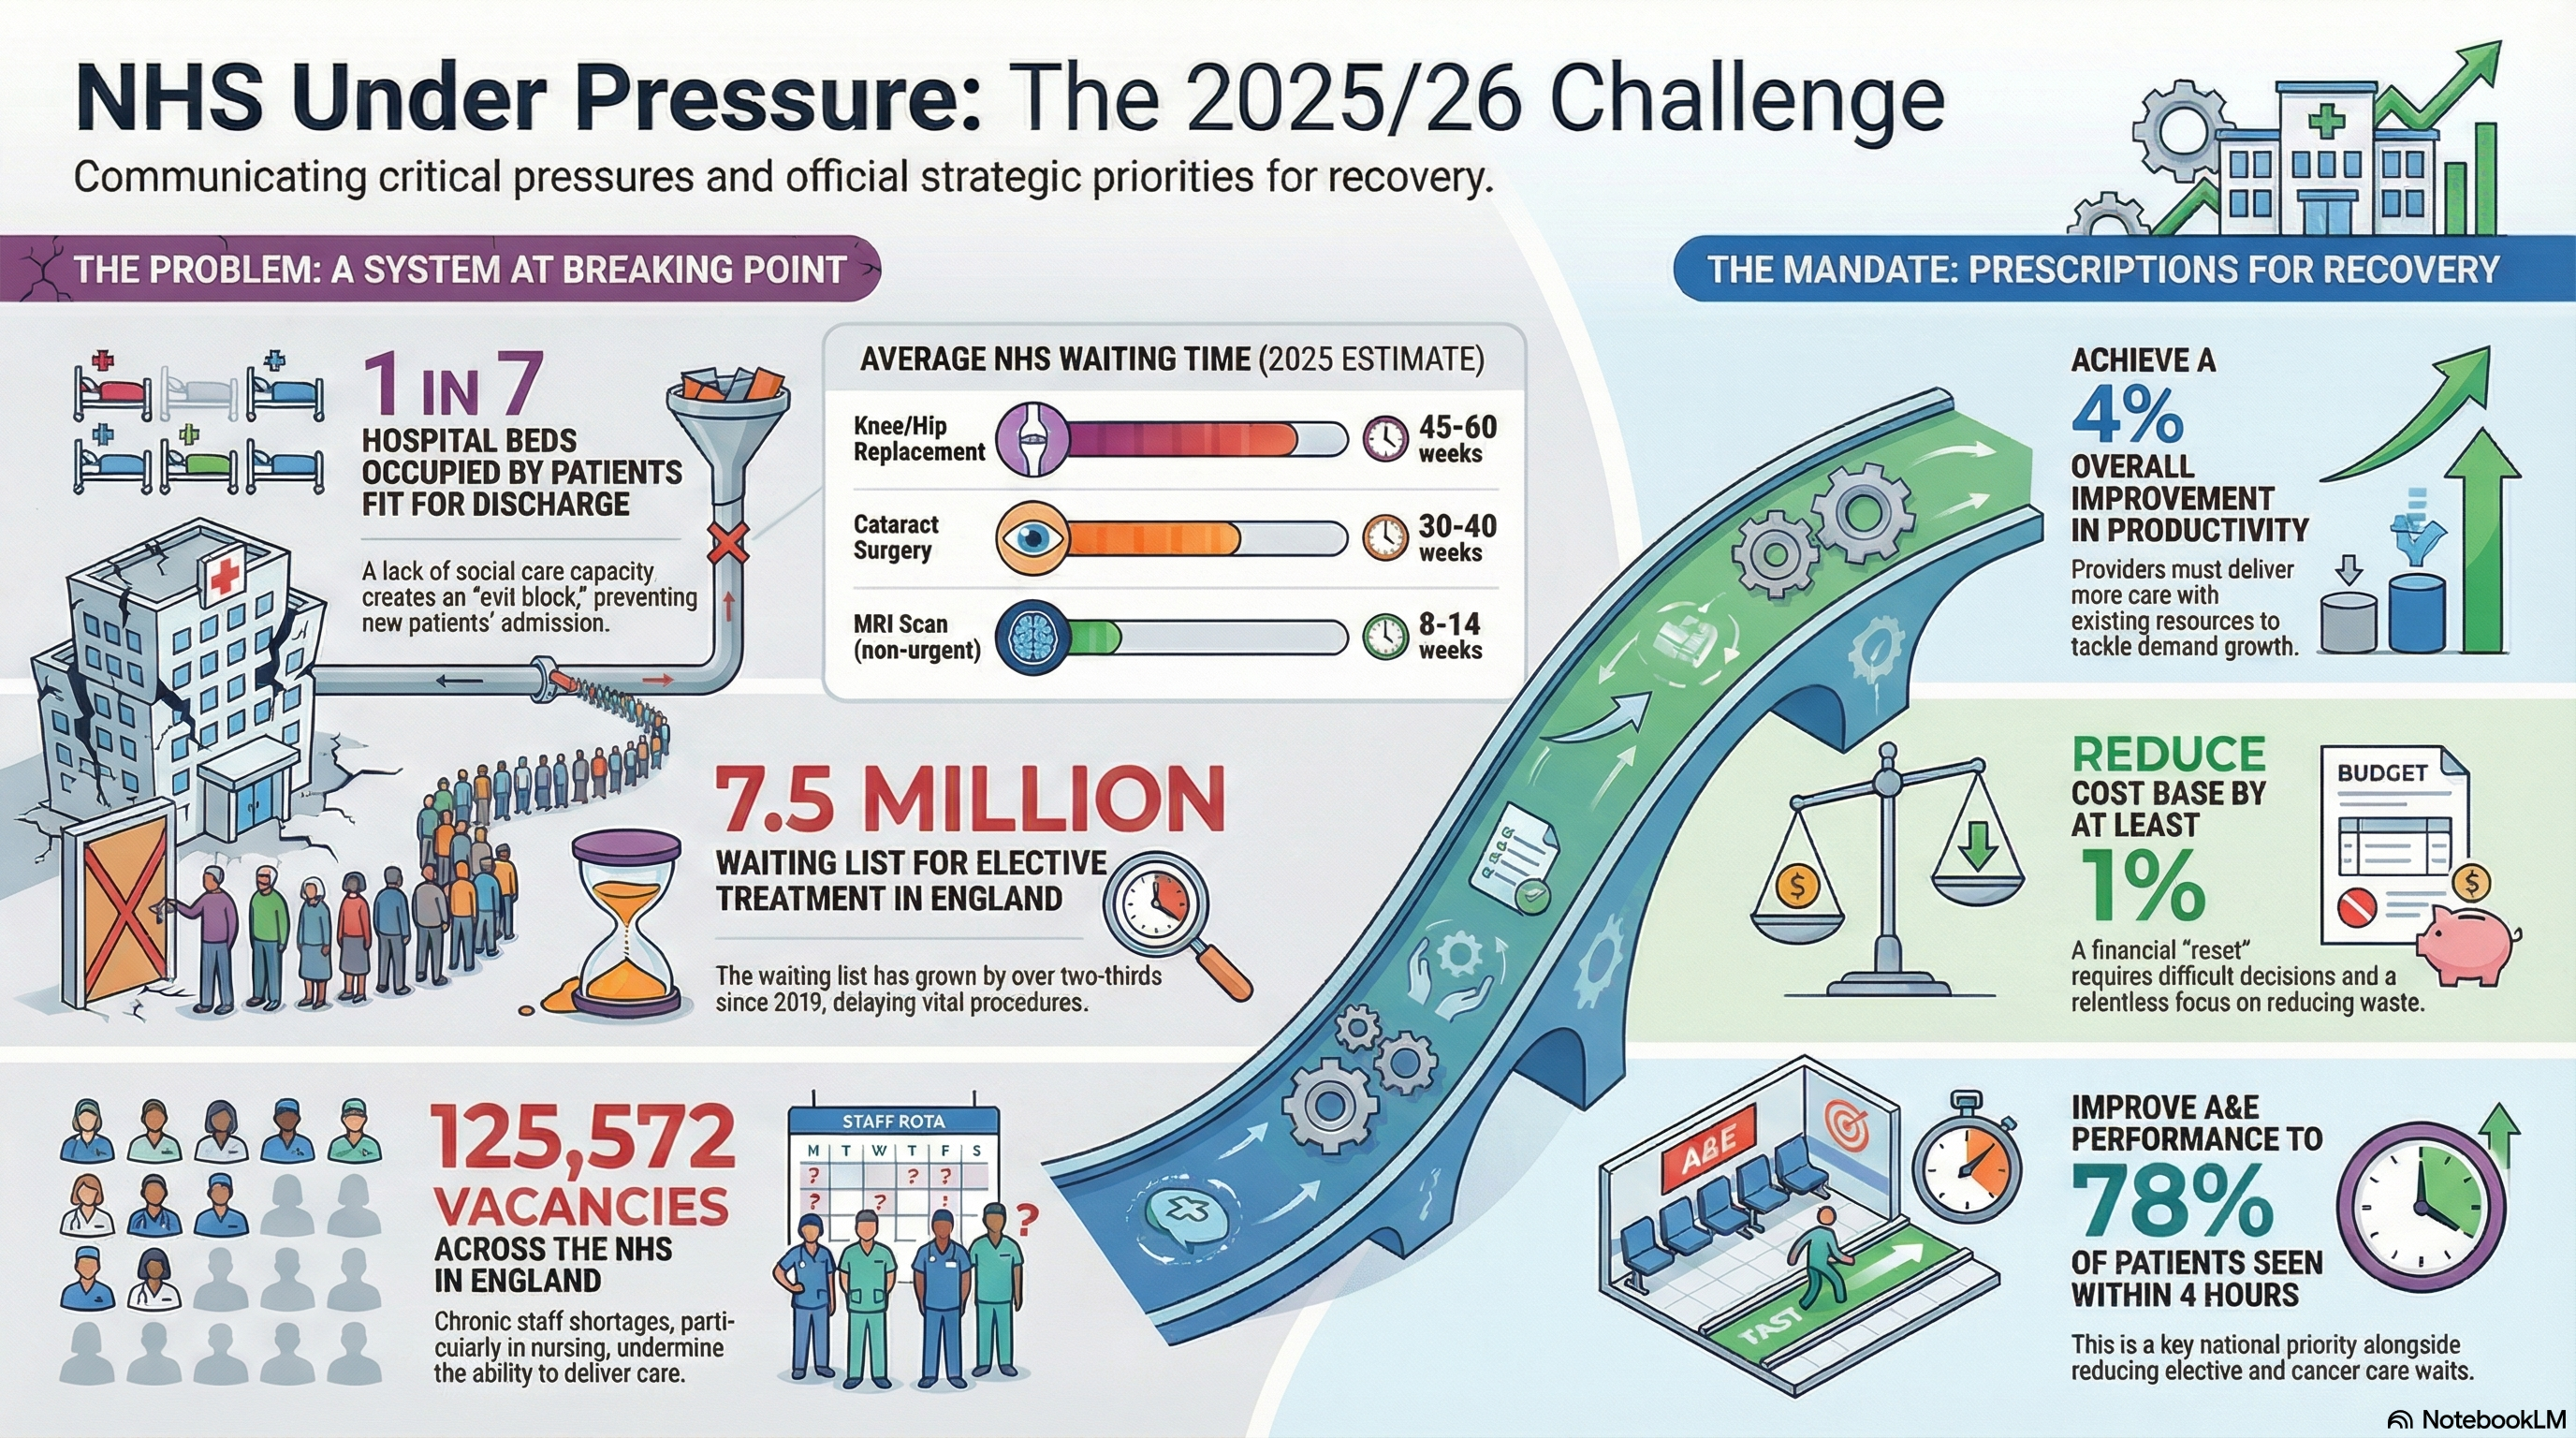
6.24M waiting list - still 2.5x pre-COVID levels
Productivity DOWN 17% since 2018 - more staff, worse outcomes
Last of 10 peer countries on cancer survival, strokes
£185bn/yr spent - double 2010 - for WORSE results
PATIENT CHOICE VOUCHER: 13-week wait = £500 for private treatment (Sweden model)
ANY QUALIFIED PROVIDER: Patient choice drives quality (Netherlands model)
STREAMLINE NHS ENGLAND: Reduce £2bn admin overhead (McKinsey review)
PERFORMANCE ACCOUNTABILITY: Transparent metrics, managed exit for underperformers
Reforms in NHS & Health will have downstream effects on 3 connected domains:
Rigorous fiscal analysis of NHS & Health reforms